


This is just a quick guide on how to get started with PlotKit. If you want to delve in deeper, be sure to check out the documentation.
Before we start, you should know a little about HTML Canvas and SVG support in the real browser world. For a more indepth coverage, please check the SVG/Canvas Browser Support Status.
Basically, Canvas and SVG have similar support across modern browsers. Canvas is supported by Opera 9, Safari 2 and Firefox 1.5, which probably only accounts for 10% of browsers. PlotKit also supports a degraded Emulated Canvas mode under IE which means you can achieve nearly 90% browser support using this technology.
However, the future is in SVG where Firefox 1.5 and Opera 8 have support it, and IE6 with the Adobe SVG Viewer (ASV) install means you get around the same coverage as HTML Canvas.
PlotKit plans to support both to maximise compatiblity. Canvas has a simplier rendering engine, but can do the equivalent to what SVG can apart from animation. SVG has wider support, but is more complex and support for key features varies widely across different implementations.
Download the latest PlotKit and MochiKit and extract it on to
your web server and make sure plotkit-0.8/PlotKit and
mochikit/MochiKit is visible.
Add the script headers for PlotKit to work.
<script type="text/javascript" src="/mochikit/MochiKit.js"></script>
<script type="text/javascript" src="/plotkit/Base.js"></script>
<script type="text/javascript" src="/plotkit/Layout.js"></script>
<script type="text/javascript" src="/plotkit/Canvas.js"></script>
<script type="text/javascript" src="/plotkit/SweetCanvas.js"></script>
MochiKit.js is an autoloader for all the elements of MochiKit. You can reduce the size of it by making your own packed version or just including the script headers individually.
The other four PlotKit javascript files deal with some basic functionality, the layout engine and two renderers, Canvas and SweetCanvas.
Now we add the <canvas> tag to where we want the graph to
appear. Note PlotKit requires the <canvas> tag is enclosed
inside a
<div><canvas id="graph" height="300" width="300"></canvas></div>
This will create a blank canvas of 300 by 300 pixels.
There are only two simple steps to draw a chart, first is the create a layout with our data and second is to create the renderer. So lets start off with creating the layout.
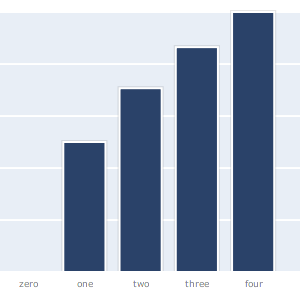
var layout = new PlotKit.Layout("bar", {});
layout.addDataset("sqrt", [[0, 0], [1, 1], [2, 1.414], [3, 1.73], [4, 2]]);
layout.evaluate();
There, it is that simple. Lets explain what each line is doing:
var layout = new PlotKit.Layout("bar", {});
We create a new layout object, and tell it that we want a bar chart in the first parameter. The second parameter allows us to pass additional options, which we will go on to later. It can be left null, or in this case just an empty array.
layout.addDataset("sqrt", [[0, 0], [1, 1]...)
This will add a new dataset to the layout. You can add multiple datasets by specifying a different name in the first parameter for each dataset. The dataset consists of an array of (x, y) values. These must be numeric, either floating point or integers.
Note that PlotKit does not deal with negative numbers at the moment.
layout.evaluate();
This will be the last command you make on the layout before passing it to the renderer. This will tell the layout to calculate the layout of the chart so the renderer can draw it. It is an expensive operation, so do not call it frequently, only unless the data or options have been changed.
 var canvas = MochiKit.DOM.getElement("graph");
 var plotter = new PlotKit.SweetCanvasRenderer(canvas, layout, {});
 plotter.render();
var canvas = MochiKit.DOM.getElement("graph");
This line will get the HTML element we defined earlier.
var plotter = new PlotKit.SweetCanvasRenderer(canvas, layout, {});
This will create the renderer to work on the object passed, and also with the data in the layout we created earlier. Again, the third parameter here is for options to relates to the look of the graph. We will show you some things you can do with this in the following section.
plotter.render()
This line will render the graph.
function drawGraph() {
    var layout = new PlotKit.Layout("bar", {});
    layout.addDataset("sqrt", [[0, 0], [1, 1], [2, 1.414], [3, 1.73], [4, 2]]);
    layout.evaluate();
    var canvas = MochiKit.DOM.getElement("graph");
    var plotter = new PlotKit.SweetCanvasRenderer(canvas, layout, {});
    plotter.render();
}
MochiKit.DOM.addLoadEvent(drawGraph);
This is a sample of what you would use to plot the graph of sqare roots for 0 to 4. Make sure you plot the graph on the load event because the DOM will not be ready if when the Javascript is first loaded.
See this in an [HTML example here][example1].
We mentioned that both the layout and renderer may take some additional options. In order to take advantage of that, we can use a simple options dictionary to store options for both layout and the renderer, in this way:
var options = {
   "IECanvasHTC": "/plotkit/iecanvas.htc",
   "colorScheme": PlotKit.Base.palette(PlotKit.Base.baseColors()[0]),
   "padding": {left: 0, right: 0, top: 10, bottom: 30},
   "xTicks": [{v:0, label:"zero"},
          {v:1, label:"one"},
          {v:2, label:"two"},
          {v:3, label:"three"},
          {v:4, label:"four"}],
   "drawYAxis": false
};

function drawGraph() {
    var layout = new PlotKit.Layout("bar", options);
    layout.addDataset("sqrt", [[0, 0], [1, 1], [2, 1.414], [3, 1.73], [4, 2]]);
    layout.evaluate();
    var canvas = MochiKit.DOM.getElement("graph");
    var plotter = new PlotKit.SweetCanvasRenderer(canvas, layout, options);
    plotter.render();
}
MochiKit.DOM.addLoadEvent(drawGraph);
Here we define some additional options to affect how our graph is rendered.
IECanvasHTC behaviour file is so that we can have IE support.
To show you that is how it works, below is the graph defined exactly how it is presented in this quick start guide. On the left is a PNG of what you should expect and on the right is what it actually renders to.
Alastair Tse - Last Updated: 17th March 2006
Content on this site is licensed under CC By Attribution unless otherwise specified. Copyright (c) 2002-2006, Alastair Tse.
For more information, see al.tse.id.au.
 Atom Feed for the Blog Entries